
Some industries paying more than $50 an hour still fell behind inflation. We compared average hourly wages by industry in British Columbia with the Consumer Price Index to see how purchasing power changed over the five years from 2021.
Even in an industry paying more than $50 an hour, wage growth failed to keep up with rising prices. Meanwhile, in accommodation and food services, where the average wage was under $20 an hour five years ago, pay grew faster than inflation.
Across BC, the average hourly wage rose by about 26.0% between September 2021 and September 2026. Over the same period, prices rose by about 19.2%. After adjusting for inflation, the real average hourly wage increased by about 5.8%. Overall, wages kept pace with prices.
Underneath that average, however, industries moved in very different directions. In high-paying professional services, the real average wage grew by more than 10%. In utilities, also a high-paying industry, it fell. A high wage doesn't guarantee protection from inflation. What you earn per hour today and how much more that hour can buy are two different things.
Over $50 an Hour, But Still Behind Inflation
In September 2021, the highest-paying of BC's 16 major industries was utilities, which covers electricity, gas and water. The average hourly wage was $50.90, about $10 more than the $40.84 earned in professional, scientific and technical services.
By September 2026, the average utilities wage had reached $53.42, an increase of only about 5.0% over five years. Prices in BC rose by about 19.2% during the same period. While the hourly wage went up on paper, it fell by about 11.9% after adjusting for inflation.
| Industry | Average hourly wage, Sept. 2021 | Average hourly wage, Sept. 2026 | Five-year increase |
|---|---|---|---|
| Utilities | $50.90 | $53.42 | +5.0% |
| Professional, scientific and technical services | $40.84 | $54.08 | +32.4% |
| Accommodation and food services | $18.88 | $24.02 | +27.2% |
Source: Statistics Canada, Table 14-10-0063-01. Average hourly wages before tax, in Canadian dollars.
Professional, scientific and technical services, which includes law, accounting, engineering and consulting, saw wages rise by about 32.4%. Its average hourly wage reached $54.08 in September 2026, overtaking utilities in that month's comparison. Two industries that both started out with high wages went in very different directions.
Note that this compares monthly estimates for September of each year, not annual average rankings. For industries with relatively few employees, such as utilities, month-to-month fluctuations in the estimates should also be kept in mind.
Accommodation and Food Services Grew Faster Than Prices From a Low Base
The average hourly wage in accommodation and food services rose from $18.88 in September 2021 to $24.02 in September 2026, an increase of about 27.2% over five years. After adjusting for inflation, real growth was about 6.8%, ahead of the BC-wide figure of about 5.8%.
Still, the industry's current average wage is about $15 below the provincial average of $39.49, and less than half the utilities average. Wages grew faster than inflation, but the gap in pay levels remains large. Growing from a low base is not the same thing as earning enough.
| Industry | Five-year wage increase | Inflation-adjusted change |
|---|---|---|
| Professional, scientific and technical services | +32.4% | +11.1% |
| Accommodation and food services | +27.2% | +6.8% |
| BC total | +26.0% | +5.8% |
| Health care and social assistance | +19.6% | +0.4% |
| Utilities | +5.0% | −11.9% |
Period: September 2021 to September 2026. BC's all-items CPI rose by about 19.2% over the same period. Sources: Statistics Canada, Tables 14-10-0063-01 and 18-10-0004-01. Rates of change and inflation adjustments calculated by Everyday Index.
Health Care: Over $6 More an Hour, but Real Wages Nearly Flat
The average hourly wage in health care and social assistance rose from $32.70 to $39.11, an increase of $6.41 an hour. That looks like a substantial raise, but the increase of about 19.6% was almost identical to the rise in prices over the same period.
After adjusting for inflation, growth was about 0.4%. Measured against average prices, the industry's average hourly wage buys almost exactly what it did five years ago. Most of the increase went toward paying for goods and services that had become more expensive.
Over the most recent year, the average hourly wage rose only about 0.3%, from $39.01 to $39.11, while prices rose about 3.0%. The real average wage fell by about 2.6% over that period. Purchasing power was roughly maintained over five years, but slipped over the past year.
Is Slow Wage Growth Only About Raises?
Looking at the health care figures, it's tempting to conclude that workers in the industry simply didn't get much of a raise. But the average hourly wage doesn't track the same people over time. It also depends on who is working in a given month.
For example, if experienced, higher-paid staff retire and more staff with less experience are hired, the average can stay flat even if existing employees get raises. Conversely, the average can rise when lower-paid jobs disappear. These figures alone can't separate the effect of raises from changes in the workforce mix.
What we're looking at here is the change in each industry's average hourly wage. Health care and social assistance, as well as education, include both public and private employers, so these are not public-sector-only figures. Monthly estimates are also subject to sampling variability and do not directly reflect any individual's pay or a specific wage settlement.
Industries That Beat Inflation, and Those That Didn't
Among the 16 major industries, forestry, fishing, mining and related industries, along with professional services, saw inflation-adjusted average wages rise by more than 10%. In contrast, wage growth in business, building and other support services and in information, culture and recreation fell short of inflation.
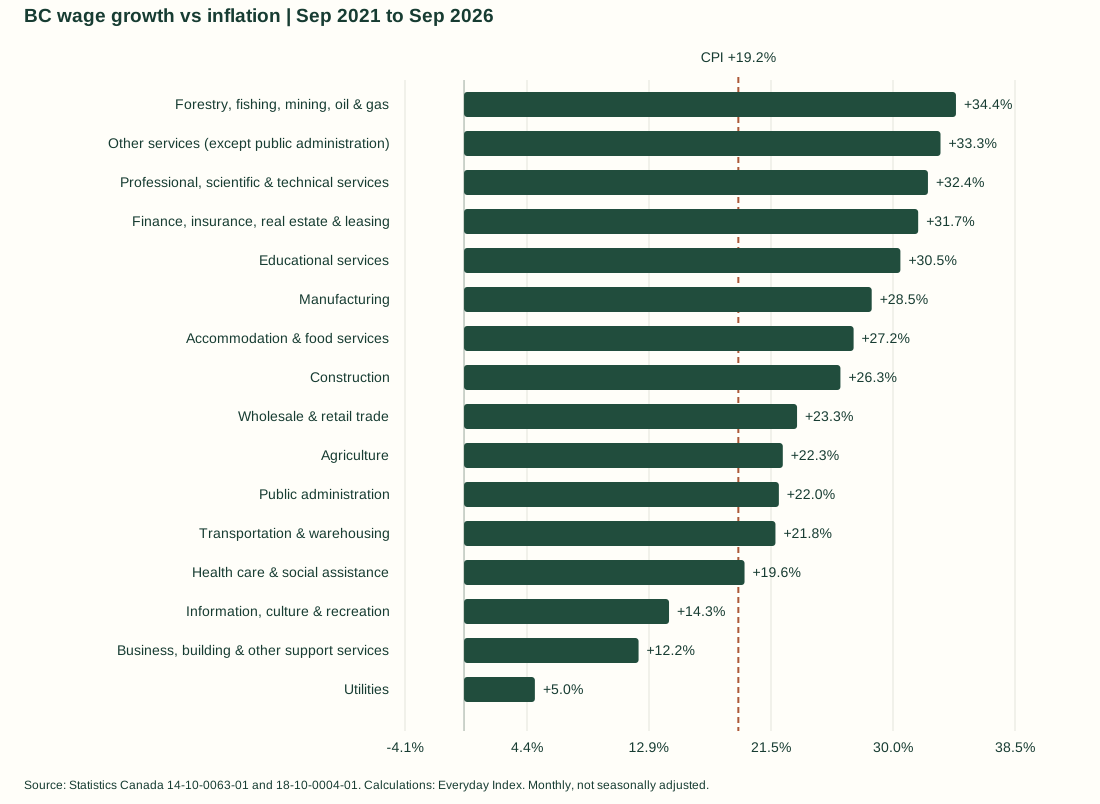
Average hourly wages rose in nominal terms in all 16 industries. After adjusting for inflation, however, they rose in only 13 and fell in three. A bigger number on your pay stub can still be swallowed up by rising prices.
Why a 26% Raise Doesn't Mean 26% More Breathing Room
To put the BC-wide change in dollar terms: an average basket of purchases that cost $100 in 2021 now costs about $119, while the average pay for the same hours of work has risen from $100 to about $126. Wages kept up with prices, but what you can actually buy increased by only about 5.8%.
CPI is also based on an average spending pattern, so households that spend a larger share on rent or food may feel the change differently. Average hourly wages are before tax and don't account for changes in hours worked. If your hourly wage rises but your hours fall, your monthly take-home pay may not increase at all.
A High Wage Isn't a Guarantee
Over these five years in BC, inflation-adjusted average wages fell in high-paying utilities, while accommodation and food services improved from a low base. Professional services combined high pay with strong growth, and health care, despite gaining more than $6 an hour on paper, only just held on to its purchasing power.
When choosing a job, the current hourly wage obviously matters. But its level alone doesn't tell you whether your income will hold up as prices rise. Even at $50 an hour, what you can buy can shrink. The real growth in your pay only becomes clear when you put your pay stub next to prices.
See the Latest Wage Data by Industry
Our Wage Growth tool compares wage growth, CPI and inflation-adjusted growth across 16 major industries. Choose BC or Canada and a one-, three- or five-year period to see how wages have changed over time.
Data and Methodology
Wages are average hourly wages of employees aged 15 and over, all genders, full-time and part-time combined, from Statistics Canada's Labour Force Survey. Self-employed workers are not included. Both wages and CPI are not seasonally adjusted, and we compared September 2021, September 2025 and September 2026. Five-year increases are cumulative, not annual averages.
The real wage change was calculated using the formula below. Because of rounding, results calculated from the figures in the tables may differ slightly.
Real change (%) = {(current average hourly wage ÷ past average hourly wage) ÷ (current CPI ÷ past CPI) − 1} × 100